A short exercise with a serious result
Twelve short questions cover the three areas that determine whether a business runs on evidence or on effort: process, data, and decisions. Answers are placed on a five-level maturity scale, then written up as they would be in a consulting engagement. Findings first, opportunities framed as business outcomes, and priorities you can actually sequence. What makes the result reliable is not the number of questions, but the order in which they are asked.
Start from what the work is meant to produce
Most business assessments start with the tools: which systems you use, whether you have dashboards, and how automated you are. This one starts earlier. Every process exists to produce a specific outcome. When it stops producing that outcome, the signs often appear in the numbers long before anyone calls it a problem. The diagnostic looks for those signs, groups them by type, and traces them back to what is producing them.
- 01
Start from what the work is meant to produce
You cannot spot a problem without a clear picture of what success looks like. Where that picture is missing, teams may find the numbers unsatisfying but cannot explain why. The first questions check whether that reference point exists, since everything that follows depends on it.
- 02
Problems show up as specific kinds of inconsistency
Business information tends to break down in recognisable ways, and each one points somewhere different. The questions target those categories, not your tooling. They ask what you notice, not what you use.
- 03
Problems cluster, and the cluster is the finding
A single inconsistency may be noise. Several in the same area point to a pattern. The report looks at where inconsistencies concentrate rather than treating each one separately, because the area with the highest concentration is often where the underlying cause sits, even when the pain is felt somewhere else.
- 04
A correct diagnosis improves the numbers
The test of a root cause is simple. When you address it, performance should improve. When it does not, what was identified was an explanation, not a cause. Acting on the wrong cause usually makes things worse. The report is written to be checked against that standard, not taken on trust.
What the questions look for
Each question targets one category of inconsistency. Together they cover common ways business information breaks down.
| Category | What it looks like |
|---|---|
| Contradiction | Two sources that cannot both be right. Often the fastest route to a broken definition. |
| Absence | Information a decision needs that nobody is capturing. Hardest to notice because nothing draws attention to it. |
| Misplaced emphasis | Effort measured as though it were outcome, or minor and major issues treated as equivalent. |
| Wrong target | Reporting aimed at a question the business is not actually asking. |
| Unclear origin | Figures whose source cannot be named and therefore cannot be verified. |
| Broken sequence | Information arriving after the decision it was meant to inform, or steps taken out of order. |
| Divergence from reality | Numbers that no longer describe what the team can plainly observe. |
None of these is unusual on its own. What the report identifies is the pattern: which categories appear, where they concentrate, and what single condition could account for all of them.
The three areas are examined in sequence, not in parallel. Data problems are interpreted against what the process was meant to produce. Decision failures are interpreted against whether the data supported them. Each finding only means something in the context of the area before it.
Process
How work actually gets done, the shape of the workflow, who owns each step, and where handovers quietly stall.
Data
Whether the numbers you rely on are complete, trusted, and accessible, or whether the picture has to be pieced together every time you need it.
Decisions
How the organisation turns information into action, who decides, how quickly, and whether the loop closes with evidence.
Each area is placed on a five-level scale. The report refers to the level, not the number, so the description stays qualitative.
| # | Level | What it means |
|---|---|---|
| 1 | Foundational | Ad hoc; work depends on individuals. |
| 2 | Developing | Some structure is in place, but it is applied unevenly. |
| 3 | Established | Routine practices are in place and understood by the team. |
| 4 | Advanced | Measured, reviewed, and deliberately improved. |
| 5 | Optimising | Continuously refined against outcomes. |
A level is a starting position, not a grade. Most organisations sit at different levels across the three areas, and the gap between them is usually more informative than any single score.
- An executive summary with a one-sentence takeaway and a maturity level
- A dashboard showing what is working, what is partial, and where to focus
- The primary opportunity, framed as a business outcome rather than a fault
- A causal chain showing how the findings connect and which single condition is most likely producing the rest
- A prioritised set of first moves, sequenced by effort and impact
- A short methodology and the confidence range of the result
All eleven pages at a glance
Each thumbnail shows the exact page produced by the report engine. They are shown for shape and structure, not for reading.
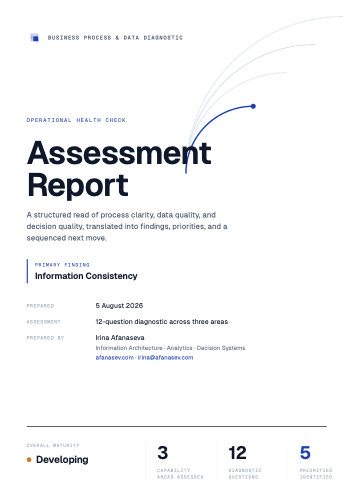 Page 1
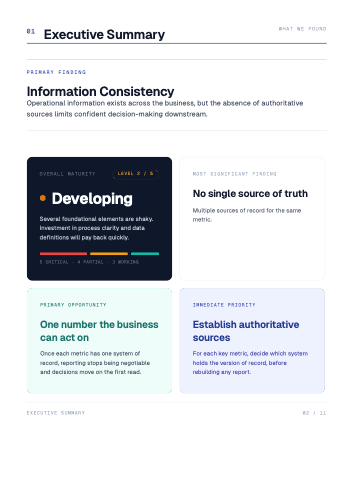 Page 2
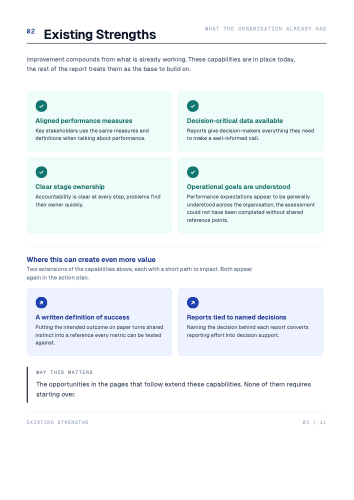 Page 3
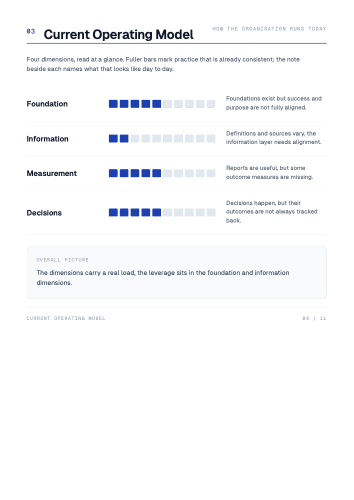 Page 4
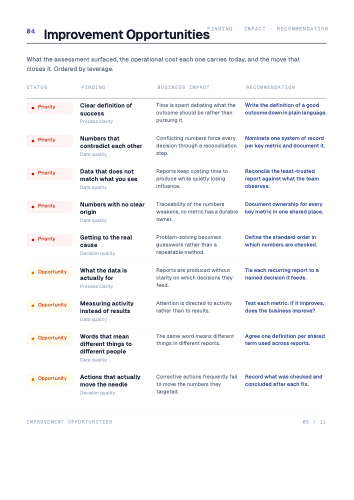 Page 5
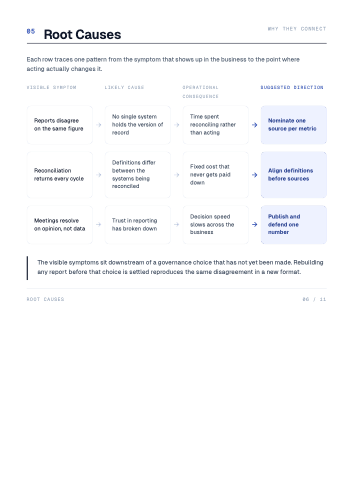 Page 6
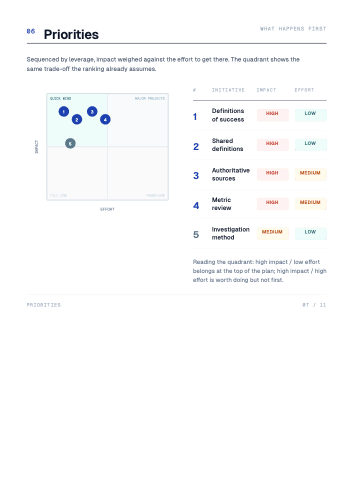 Page 7
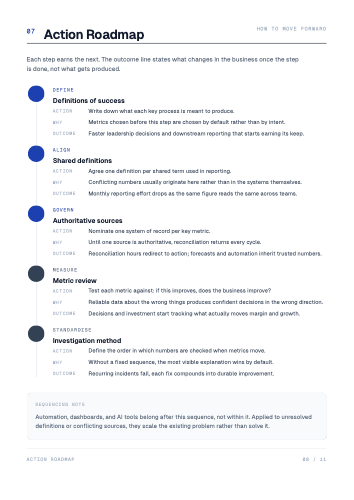 Page 8
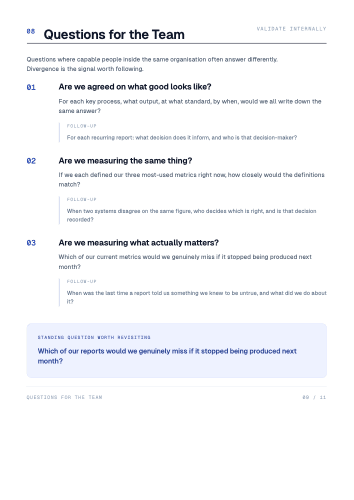 Page 9
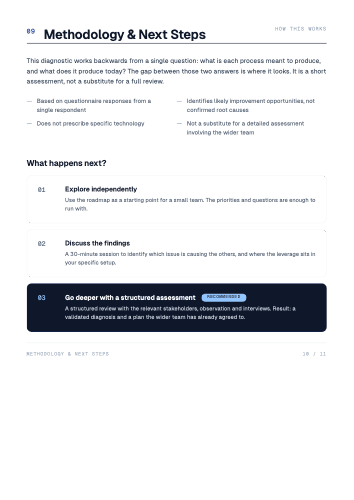 Page 10
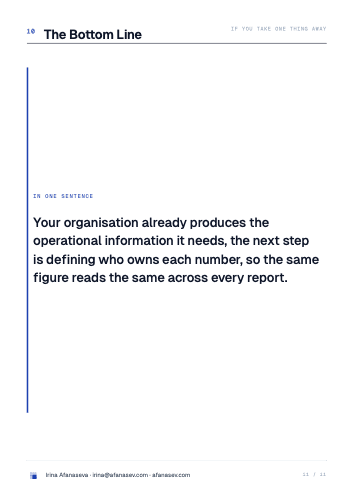 Page 11
Ready to see your own read?
Five minutes, twelve questions, no sign-up. You receive the same eleven-page report by email.
Start the diagnostic